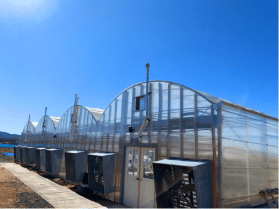
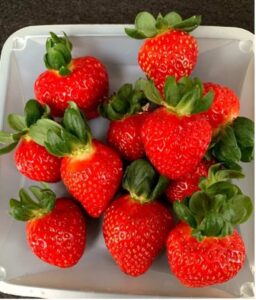
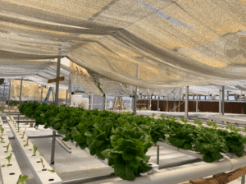
+17% Yield Boost in Romaine Lettuce Trial AT A GLANCE Results Crop Farm Location +17 % Wet Weight at maturity; +6.1% average Leaf Length. Lactuca sativa L. ‘Coastal Star’ Romaine Lettuce. Santa Fe Community College Research Greenhouse. *This work was independently performed by SFCC students Jen Lein and Amanda Garcia with advising by Controlled Environment Agriculture professor Charlie Shultz and greenhouse manager Pedro Casas. Film donation and data analysis were provided by UbiQD, Inc. Santa Fe, NM, USA DOWNLOAD CASE STUDY PDF ABOUT THE PROJECT This study monitored the growth and development of ‘Coastal Star’ romaine lettuce crops, improving crop yields by growing romaine lettuce under an orange-red UbiGro luminescent quantum dot (QD) greenhouse film, and identical high yield lettuce crops grown under a colorless control film at the Santa Fe Community College Research Greenhouse in 2021. These agricultural farming techniques aimed to evaluate the effectiveness of advanced greenhouse technology in improving crop yield. EXPERIMENT UbiGro QD greenhouse films emitting at 600 nm were installed above a 254 ft² (23.6 m²) nutrient film technique (NFT) system inside the Santa Fe Community College Research Greenhouse (SolaWrap cover, 83% PAR transmission). An identical neighboring NFT area in the greenhouse was chosen to serve as the control group, over which a clear polyethylene film (K50 Clear 6 mil, RKW Klerks) was installed to balance the light intensities and diffusivities between the two areas (see Table 1 describing the haze and transmission of the QD film and the polyethylene control film). A reflective mylar barrier was hung between the two areas to prevent light mixing between treatment areas. A Watchdog Plant Growth Micro Station with four quantum light sensors was installed to measure daily light integral (DLI) on each side of the experiment using five-minute measurement spacings. Crops, including romaine lettuce, were grown with Calcium Nitrate, Magnesium Sulfate, and Potassium Nitrate-rich nutrient salt solutions with targets of EC 1.7 and pH 5.8. In order to better achieve proper light intensity and improve crop yields for growing romaine lettuce, shade curtains were deployed over the crops in both treatments until August 26 (covering the first three crops in this experiment), when they were removed. These adjustments provided insights into how to grow lettuce fast while maintaining optimal crop health. Table 1. Optical properties of the QD film and the polyethylene control film. Every week for 12 weeks starting in July 2021, two groups of 27 plants were seeded in Oasis Rootcubes on an ebb-and-flow seedling table inside the greenhouse. Each pair of plant groups was transplanted into the NFT system, under the QD film and control films, at 21 days after sowing (DAS). In order to explore differences in growth rates over time, each transplant group was split into three subgroups, where each subgroup consisted of 9 plants. Each subgroup was harvested a week apart from the others in order to explore all stages of growth – early to late (mature). The staggered harvest times ranged from 39 DAS to 59 DAS. Separating the staggered harvests into DAS ranges allows a better understanding of how development changes over time under the altered QD film spectrum. Amongst 12 crop groups, including romaine lettuce, a total of 35 individual harvests (subgroups) were made during the experiment. These efforts were aimed at exploring ways to improve crop yields. The first harvest was completed on August 20, 2021, and the final harvest was completed on November 23, 2021, showcasing the effectiveness of high yield lettuce techniques, how to grow lettuce fast, and agricultural farming techniques. HARVEST DATA Staggered harvests were grouped into similar DAS ranges, as indicated in Table 2, such that four growth stages were explored: very early growth (39 DAS), early growth (44-46 DAS), mid growth (51-53 DAS), and late growth (56-59 DAS). Due to labor scheduling, the harvests were conducted ±2 days from the target nominal DAS. The maturity time for this lettuce species, including romaine lettuce, is 57 DAYS according to seed purveyor Johnny Seeds, so these ranges represent harvest times up to a typical harvest time for a commercial grower. However, this 57-day maturity time can vary with sunlight intensity, seasonality, climate, and other variables, which are critical factors in growing romaine lettuce. *Table 2. Harvested wet weights, % difference and p-value for lettuce harvests from four growth stages. * indicates that the difference is not significant beyond a 95% confidence threshold. Average wet weights for each harvest were compared across all crops, and are shown in Table 2 and in the form of growth curves in Figure 1 and bar plots in Figure 2. Harvest results outside of one standard deviation from the mean were excluded as outliers. Plants grown under the QD film exhibited larger wet weights for all DAS ranges. The largest yield increases were for the very early and early harvest windows, +20% and +28%, respectively. The mid stage showed a small yield increase of +4%. The late harvest showed a +17% yield improvement which represents the total growth during the full period. This late stage growth represents the most impactful result of this experiment, as a commercial grower would grow out their romaine lettuce crop to full maturity and realize the yield benefit in terms of greater revenue (if selling by weight) or faster growth cycles (if selling by headcount). This yield boost for the mature crop translated to the ability to harvest the same size crop 2-3 days earlier, demonstrating the effectiveness of high yield lettuce, advanced agricultural farming techniques, and methods to improve crop yields. Additionally, these results offer insights into how to grow lettuce fast, which is vital for optimizing production cycles. *Figure 1. Top: Growth curves for lettuce grown under the QD film and under the control film, with 1 standard deviation error bars. Bottom: Average wet weight yield increases for different DAS ranges for staggered harvests. *Figure 2. Average wet weight yields for different DAS ranges for staggered harvests, with 1 standard deviation error bars. Plots marked with the same letter are not